All of these Treasury securities have been sold. So here are the holders.
By Wolf Richter for WOLF STREET.
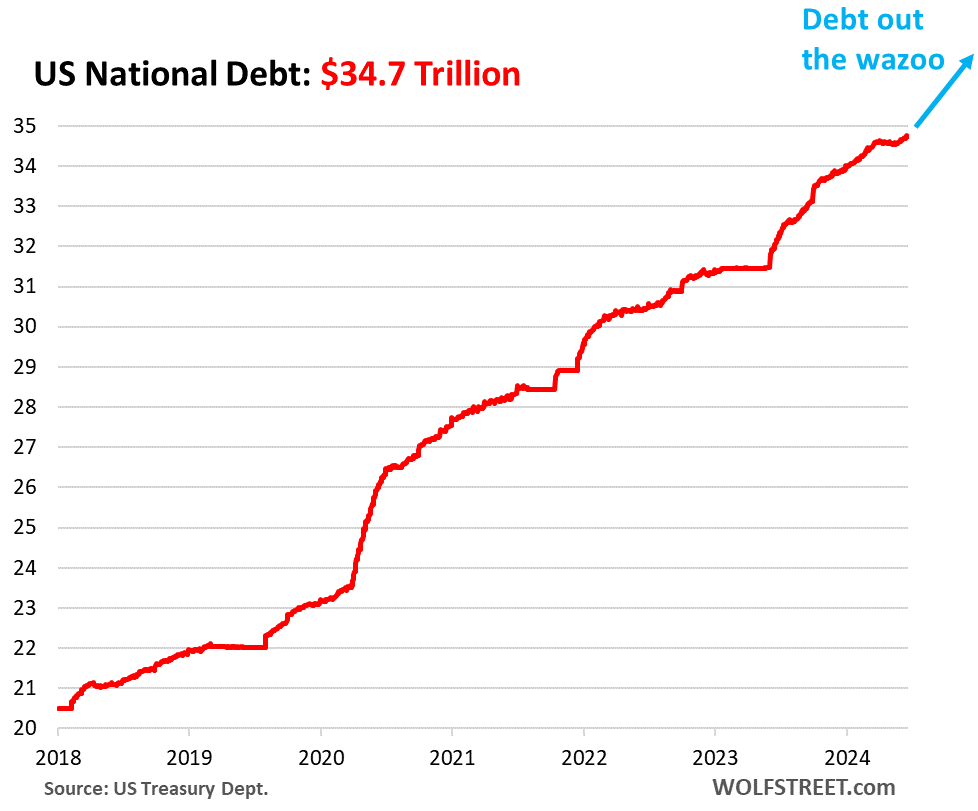
The US national debt – now $34.7 trillion, up from $23.3 trillion in January 2020, and from $27.6 trillion in January 2021 – has spiked so fast that it would make our eyes water with disbelief, if we didn’t know better. Over the four years and five months since January 2020, it has spiked by $11.4 trillion. Since the pandemic trough, the economy has been growing rapidly, yet trillions were flying by so fast it’s hard to see them. We don’t even want to imagine what this will look like during the next recession.
But every single one of the Treasury securities that the government issued was bought, and we’ll get to the holders in a moment:
Who holds this $34.7 trillion in debt?
Every single one of these Treasury securities is held by some entity or individual. So here they are.
US Government funds: $7.1 trillion. Held by various US government pension funds and by the Social Security Trust Fund (we discussed the SS Trust Fund holdings, income, and outgo here). These Treasury securities are not traded in the market, but are purchased directly by the funds from the Treasury Department, and at maturity are redeemed at face value. They’re called, “held internally,” and are not subject to the yield-whims of the markets.
The remainder amounts to $27.6 trillion currently, they’re the securities “held by the public.”
A small portion of these $27.6 trillion in securities cannot be traded, such as savings bonds (including the popular I bonds), and some other bond issues.
The remainder are Treasury bills, notes, and bonds, plus Treasury Inflation Protected Securities (TIPS), and Floating Rate Notes (FRN). These securities are traded (“marketable”). At the end of Q1 – that’s the timeframe we look at below), there were $26.9 trillion of these securities outstanding.
Foreign holders: $8.0 trillion. Includes private sector holdings, and official holdings, such as by central banks. China, Brazil and other countries have been reducing their holdings for years. European countries, the big financial centers, Canada, India and other countries have been loading up. In total, foreign holdings rose to an all-time high in March and dipped a little in April, which was still the second highest ever. While foreign holders in aggregate have increased their holdings in dollar terms over the years, their share of the total debt outstanding has plunged from 33% a decade ago, to 22.9% now because they have not kept up with the rapid increase of the US debt (we discussed the details of those foreign holders here).
The rest is in the hands of US Holders.
The Securities Industry and Financial Markets Association (SIFMA) just released its Quarterly Fixed Income Report for Q1. It doesn’t spell out the dollar amounts, but the percentage of Treasury bills, notes, bonds, TIPS, and FRNs outstanding. As of March, there were $26.9 trillion of these Treasury securities outstanding. And they were held by:
US mutual funds: 18.0% of Treasury securities outstanding (about $4.8 trillion). They include bond mutual funds that hold Treasury securities, and the T-bill holdings at money market mutual funds.
Federal Reserve: 16.9% of Treasury securities outstanding (about $4.6 trillion in March). Under its QT program, the Fed has already shed $1.31 trillion of its Treasury securities since the peak in June 2022 (our latest update on the Fed’s QT).
US Individuals: 9.8% of Treasury securities outstanding (about $2.6 trillion). These are people who hold them in their accounts in the US.
Banks: 8.1% of Treasury securities outstanding (about $2.2 trillion). We saw in March 2023, banks hold a lot of long-term Treasury securities and MBS that lost a lot of market value due to the rise in yields, and as depositors saw this and got scared and yanked their money out, some banks collapsed. According to FDIC data, the total amount of all types of securities held by banks – Treasury securities, MBS, and other securities – was $5.5 trillion at the end of Q1, with cumulative unrealized losses on all their securities rising to $517 billion. The $2.2 trillion are just Treasury securities.
State and local governments: 6.3% of Treasury securities outstanding (about $1.7 trillion).
Pension funds: 4.3% of Treasury securities outstanding (about $1.2 trillion).
Insurance companies: 1.9% of Treasury securities outstanding (about $510 billion). Warren Buffett’s insurance conglomerate, Berkshire Hathaway, has increased its holdings of T-bills to $153 billion.
Other: 1.5% of Treasury securities outstanding (about $400 billion).
This shows just how far and wide Treasury securities are spread. If these investors lose interest at current yields and demand at current yield vanishes, yields have to rise until sufficient demand materializes. And that can happen all of a sudden, which we saw happen when the 10-year yield briefly pierced 5% in October, unleashing a torrent of demand that bid up prices, and so the yield plunged again. Currently, amid blistering demand, the 10-year yield is back down to 4.25%, even though T-bill yields are close to 5.5%.
To what extent are interest payments eating up the national income, and how long can this continue? See… Spiking Interest Payments on the Ballooning US Government Debt v. Tax Receipts and Inflation: Q1 Update
Enjoy reading WOLF STREET and want to support it? You can donate. I appreciate it immensely. Click on the beer and iced-tea mug to find out how:

Would you like to be notified via email when WOLF STREET publishes a new article? Sign up here.
![]()

Barbara Terrio is a seasoned business journalist, delving into the world of finance, startups, and entrepreneurship. With a knack for demystifying complex economic trends, she helps readers navigate the business landscape. Outside of her reporting, Barbara is an advocate for financial literacy and enjoys mentoring aspiring entrepreneurs.


/cdn.vox-cdn.com/uploads/chorus_asset/file/25283723/STK048_XBOX_B.jpg)